Customer satisfaction metrics are the numbers that show how happy customers are with your product and service: CSAT for individual interactions, NPS for loyalty, customer effort score for ease, negative response rate for the unhappy tail and churn rate for what customers actually do. Measure them through surveys, email, chat, reviews, analytics and interviews, and read the support conversations behind them for CSAT improvement.
In short
- CSAT is satisfied responses divided by total responses, times 100.
- NPS is the percentage of promoters minus the percentage of detractors.
- Pair survey scores with behavior like churn and repeat contacts.
- Surveys reach few customers, so review conversations too.
What are customer satisfaction metrics?
Customer satisfaction metrics are measurements that turn how customers feel about your company into numbers you can track, compare and act on. They come in two types: survey metrics, where you ask the customer, and behavioral metrics, where you watch what they do.
Survey metrics such as CSAT, NPS and CES capture opinion right after an interaction or across the relationship. Behavioral metrics such as churn, repeat contacts and reopened tickets cover every customer, including the ones who never answer a survey. A good measurement setup uses at least one of each, because opinion without behavior is easy to misread, and behavior without opinion does not tell you why.
Why measuring customer satisfaction is important
Measuring customer satisfaction is important because it tells you where the experience falls short before customers leave, and which fixes will matter most. Without a number, every improvement is a guess.
Deciding which customer service metrics you will track guides your team in five ways:
- Understanding customer needs: feedback shows what customers want from your product, service and support.
- Finding what to improve: low scores point at the product areas, processes or skills that fall short.
- Keeping customers: you can step in with an unhappy customer before they churn.
- Protecting your reputation: fixing the causes of bad experiences means fewer negative reviews.
- Driving growth: satisfied customers buy more and refer others.
The business case for satisfaction itself, with the evidence, is in our guide to the importance of customer satisfaction.
5 most important customer satisfaction metrics to analyze
The five customer satisfaction metrics worth tracking are CSAT, negative response rate (DSAT), NPS, customer effort score and churn rate, with an internal quality score next to them. The table compares what each one tells you and how to calculate it; these insights also help you improve your customer service performance.
| Metric | Type | What it tells you | How to calculate | When to use it |
|---|---|---|---|---|
| CSAT | Survey | How satisfied customers were with one interaction | Satisfied responses ÷ total responses × 100 | After tickets, chats and calls |
| NRR (DSAT) | Survey | How often customers are unhappy | Negative responses ÷ total responses × 100 | Alongside CSAT, per agent and team |
| NPS | Survey | How likely customers are to recommend you | % promoters minus % detractors | Quarterly or twice a year |
| CES | Survey | How easy it was to get help | % of customers who agree it was easy, or the average score | After support or self-service journeys |
| Churn rate | Behavior | How many customers you are losing | Customers lost ÷ customers at the start of the period × 100 | Monthly or quarterly |
| IQS | Conversation quality | How well your team performed, by your own standard | Conversations scored against your QA scorecard | Continuously, next to CSAT |
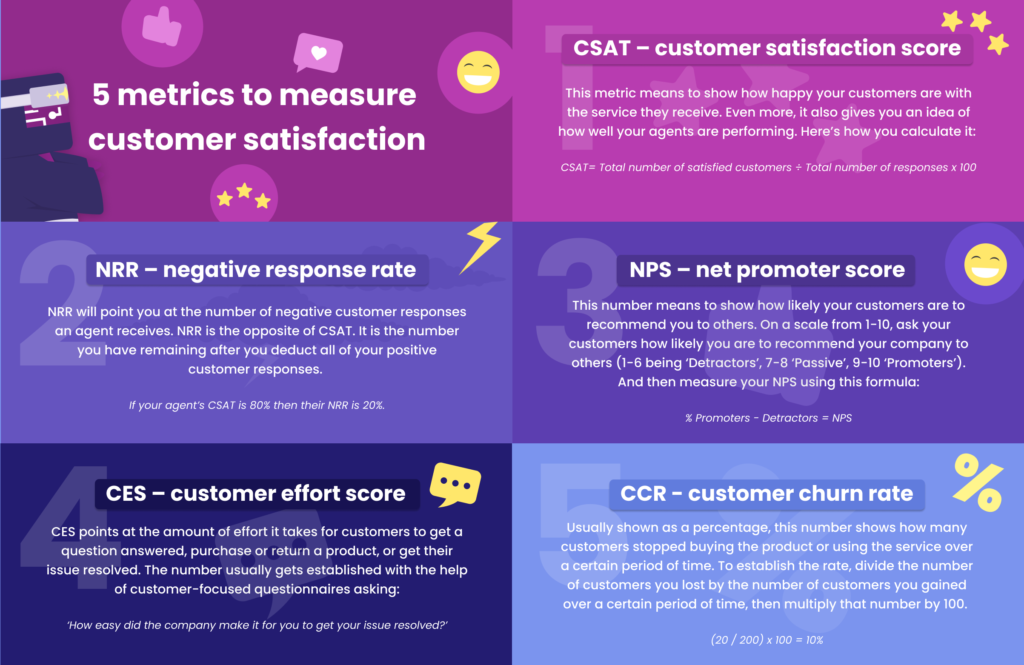
1. CSAT – customer satisfaction score
The customer satisfaction score, or CSAT metric, is helpful in determining not only how happy your customers are, but also how well your agents are performing. For the full definition and scales, see what is CSAT.
Formula: CSAT = (number of satisfied responses ÷ total number of responses) × 100
This CSAT calculation will help you understand your score across all customers. It will also help you determine where your agents can improve or where you can tweak their training. After all, performance coaching is the new way to manage your customer support teams to make sure they experience continuous growth at the workplace.
Getting regular feedback from customers gives you a window into their minds. This insight makes it easier to increase your CSAT score as you’ll know firsthand how you can improve their overall experience.
For example, if a common customer complaint is having their call transferred too many times, you can identify new ways to train your agents so they’re prepared to answer all the most commonly asked questions during the first interaction.
2. NRR – negative response rate
The negative response rate (NRR) is also known as DSAT or BADSAT; our guide to DSAT meaning covers the thresholds in detail. It’s a metric used to measure the number of negative customer responses an agent receives. This means going through your customer feedback and calculating the number of responses that are under your positive satisfaction rate threshold.
For example, if your CSAT score ranges from 1-10, you may decide that anything under 8 is not acceptable.
The NRR is related to the CSAT score, but it is not simply its inverse. If your scale has a neutral rating, those responses count in neither number, so a CSAT of 75% does not mean an NRR of 25%. Our comparison of CSAT vs DSAT works through one survey to show the gap.
These direct insights allow your team to:
- Improve internal processes, products/services, and agent performance
- Drive customer retention and loyalty
- Increase employee motivation and engagement
3. NPS – net promoter score
While your CSAT score will tell you how happy your customers are, the net promoter score (NPS) will tell you how that satisfaction might translate into telling other people about your company. In other words, it’s how likely customers will be to recommend your company to others.
In Nielsen’s 2012 global survey, 92% of consumers said they trust earned media, such as recommendations from people they know, more than any other form of advertising. Turning your customers into promoters is worth the effort. The scale, segments and pitfalls are in our guide to NPS meaning.
To find your NPS, ask your customers the specific question of how likely they are to recommend your company, product, or service to their friends and family. Use a scale of 0-10; where 0 could be ‘not at all’ and 10 could be ‘definitely recommend’. You can then calculate your NPS by subtracting the percentage of detractors from that of promoters. The higher the score, the better.
Here’s an example. Say 10% of your respondents are detractors and 20% are promoters: your NPS is 10. A score above zero means you have more promoters than detractors, so work to keep growing that gap.
4. CES – customer effort score
The amount of effort it takes for customers to get a question answered, purchase or return a product, or get their issue resolved is the customer effort score or CES. While this may sound like a vague metric, it’s definitely measurable, and improving it can increase customer satisfaction and brand advocacy.
On the other hand, not focusing on your CES score can result in customers speaking negatively about your company.
CES is measured by asking a single question of your customers and scoring the response on a scale, from 1 to 7 for example, with 1 representing the highest level of disagreement with the statement. You can then calculate the percentage of customers that at least ‘somewhat agree’ (those who give a 5 or above) with the statement that the company made it easy to resolve their issue, or report the average score.
These numbers show where the service experience asks too much of customers. The question wording, scales and ways to lower effort are in our guide to the customer effort score.
5. Customer churn rate
The customer churn rate is the number of customers who stop buying your products or services over a given time period. It’s usually expressed as a percentage and helps build a more complete view of customer satisfaction and overall business growth.
To calculate your customer churn rate, pick a time period and divide the number of customers lost in that period by the number of customers you had at the start of it. Then multiply by 100 to get the percentage.
For example, let’s say you started Q2 with 300 customers and lost 30 of them during the quarter. Your customer churn rate would be calculated like this:
(30 / 300) x 100 = 10%
Churn varies too much by industry and business model for a single benchmark to be useful, so compare against your own history. For a company to grow, the number of new customers in a given period must surpass the number it loses.
Measure your ‘true’ CSAT
Your true CSAT is the score that reflects what your agents controlled, after you separate out ratings caused by policy, product or circumstances outside their hands. Without that split, a fair evaluation is impossible.
Most of the time, a negative rating is valuable feedback about how a conversation went. Sometimes, though, the customer was unhappy with a refund rule, a delivery delay or a bug the agent could not fix. Counting those against the agent is highly demotivating and points coaching at the wrong problem.
Read the conversation behind each negative rating and tag the main cause: agent handling, process or policy, or product. Report agent-related DSAT next to the overall figure. A quality assurance review helps here: in Kaizo, every score links to the evidence in the transcript, so a disputed rating is settled by reading the conversation rather than arguing about it.
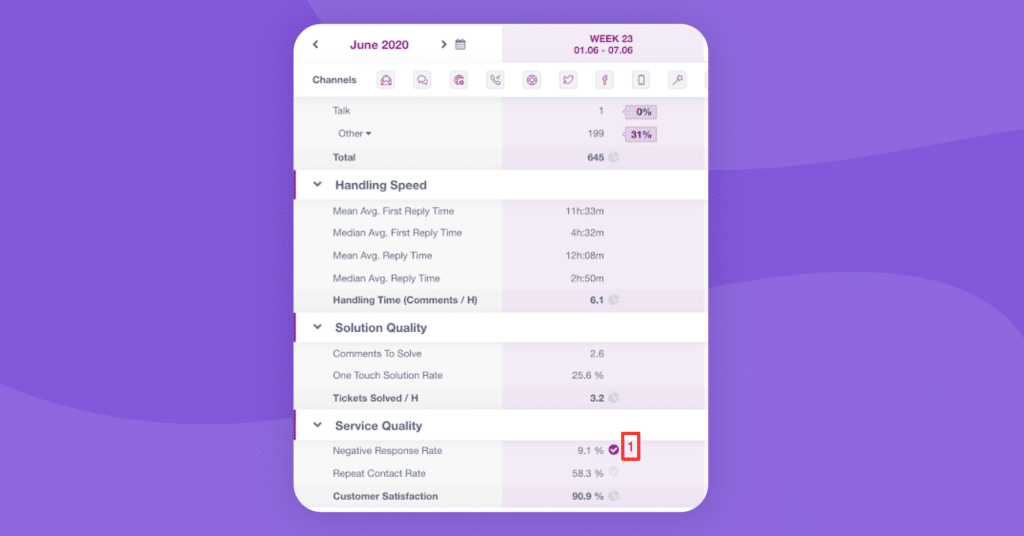
Calculating your true CSAT score means agents receive a fair evaluation. That motivates them, instead of leaving them feeling they have zero control over their metrics.
7 ways to measure customer satisfaction
The seven ways to measure customer satisfaction are online surveys, email, social media and forums, live chat or phone, analytics, reviews, and interviews or focus groups. Most teams combine three or four of them.
1. Online surveys
Putting together a survey is fairly straightforward, but you’ll want to put thought into it. Take care to include a reasonable number of questions and to gather the information that’s most important.
Use questions that help add to your determined CSAT metrics. Make the questions simple to answer, not too lengthy, easy to understand, and helpful for your company and agents.
Conducting customer surveys is a popular and direct method to gauge customer satisfaction. Surveys can be administered through various channels, such as email, online forms, or in-app surveys.
Design your surveys to capture both quantitative and qualitative feedback, including rating scales, open-ended questions, and Net Promoter Score (NPS) measurements. Analyzing survey responses provides valuable insights into customer perceptions, preferences, and areas where improvements can be made.
2. Email
While you can email the survey you’ve created, you can also use customer service email templates to ask people for feedback. Post-purchase follow-up emails are also a great strategy to get insights from customers. You can ask them about their experience and what you can improve.
Let customers reply directly to these emails to make it easier for them to get in touch. This will also add a personal touch and hopefully make it more conversational so you can truly understand their feedback.
3. Social media or community forum
Customers share good and bad experiences on social media, and prospects use the same channels to research products, services and brands. If people are talking about your company on social media, you’ll want to know what they’re saying.
Fortunately, there are many social listening tools to help keep track of this. Sometimes, though, going through a handful of social media posts yourself can be the best way to see what people really think. You could even set up a simple Google Alert to help you.
If you have the resources, you can also create a community forum on your website. Make it a place where customers can discuss questions, challenges, praises, and more. This way, you can learn what people love, hate, and everything in between directly from your own site.
4. Live chat or phone call
Adding a live chat function to your website makes it easier for customers to get in touch, which makes it easier to receive feedback. The same goes with offering phone support. Once customers start a chat or call your support center, agents can personally ask if they’re satisfied with the service they received. This is usually a simple yes or no question, however, and doesn’t give you a specific number.
For customers who may not be open to providing feedback directly, you can incorporate an in-app or on-call satisfaction feature. These automations ask customers after your conversation whether they were helped and if they’re satisfied with the service. This will also provide you with more specific, measurable results.
5. Analytics
Numbers can tell you much more than you think they can. For one thing, your website traffic and bounce rate do not just show how popular your website is. They also show you how satisfied your customers are with their online experience with the service.
You can take a moment to analyze how long people stay on each specific webpage, how many of them subscribe or unsubscribe from your newsletter, and what their journey from one webpage to another webpage is like. It is the type of data you always have available and do not need to reach out to your customers.
6. Customer feedback and reviews
Monitoring and analyzing customer feedback and reviews is an essential way to measure customer satisfaction. This includes online reviews on platforms like Google, Yelp, or social media, as well as direct feedback received via customer support channels.
Pay attention to both positive and negative feedback, as they can highlight strengths and weaknesses in your offerings. Encourage customers to share their feedback by providing accessible feedback mechanisms and actively responding to their concerns.
7. Customer interviews and focus groups
Engaging customers through interviews and focus groups allows for more in-depth conversations and qualitative insights. By conducting one-on-one interviews or assembling a small group of customers, you can explore their experiences, perceptions, and expectations in detail.
This qualitative data provides rich insights into the emotions, motivations, and specific pain points of your customers. Use these insights to uncover hidden issues and identify opportunities for improvement.
How to measure customer satisfaction without surveys
You can measure customer satisfaction without surveys by tracking behavior and reading conversations: repeat contacts, reopened tickets, escalations, churn and the sentiment inside support conversations.
Survey metrics only hear from the customers who answer. Behavioral metrics cover everyone: a customer who contacts you twice about one issue, or whose ticket reopens, is telling you the first answer failed, whether or not they fill in a survey. First contact resolution is the cleanest of these signals. Conversation-level measurement goes one step further: customer sentiment analysis and QA scoring read what happened in each interaction, so you can see dissatisfaction that never produced a rating. Our guide to customer dissatisfaction lists the warning signs to watch.
Put your customer satisfaction metrics on one dashboard
Start by putting your survey, behavior and quality metrics side by side, so a change in one can be explained by the others. Measuring customer satisfaction is only useful when the data leads to a decision.
Evaluating and calculating these metrics by hand is time-consuming. Kaizo’s AutoPilot scores every support conversation against your own scorecard once it resolves, and Kaizo Insights brings QA, sentiment, coaching and performance into one view, so you can see which conversations sit behind a falling score. To see it with realistic sample data, book a meeting.
Frequently asked questions
What is the best way to measure customer satisfaction?
Use more than one metric. CSAT after interactions shows how individual contacts went, NPS shows loyalty, customer effort score shows how easy you are to deal with, and churn shows what customers actually do. Add a review of support conversations, because most customers never answer a survey.
What is a good CSAT score?
It depends on your industry, your scale and how you define a satisfied response, so compare yourself with your own trend first. A score that rises steadily while repeat contacts fall is a better sign than any single benchmark. If you compare with others, check that they count the same ratings as satisfied, because counting only the top two ratings on a 1 to 5 scale gives a very different number than counting the top three.
How often should you measure customer satisfaction?
Send CSAT surveys after each interaction so you get a continuous signal. Run NPS less often, quarterly or twice a year, so customers do not tire of it. Track churn monthly or quarterly, depending on your billing cycle. Behavioral metrics such as repeat contacts and quality scores can run continuously, because they do not depend on customers answering anything.
What type of metrics measure customer satisfaction?
Two types of metrics measure customer satisfaction. Survey metrics, such as CSAT, NPS and customer effort score, ask customers how they feel. Behavioral metrics, such as churn rate, repeat-contact rate and reopened tickets, show what customers do. A third layer, conversation quality and sentiment, explains why the numbers move, because it looks at what actually happened in each interaction.
How do you calculate customer satisfaction?
The most common calculation is CSAT: divide the number of satisfied responses by the total number of responses and multiply by 100. If 160 of 200 respondents rate you 4 or 5 on a 1 to 5 scale, your CSAT is 80%. Write down which ratings count as satisfied, and keep that definition stable so the trend stays comparable.