Customer service KPIs are the handful of metrics a support team commits to improving, such as CSAT, first contact resolution and first reply time. The 15 below each come with a formula, a sourced benchmark where one exists, and the trap it hides.
In short
- Track five to seven KPIs, one per question you need answered.
- Pair every speed metric with a quality metric on the same conversations.
- Use published benchmarks as a reference, and your own trend as the target.
- Every metric lies a little when you optimize it in isolation.
What are customer service KPIs?
Customer service KPIs are the metrics you have committed to moving this quarter, each with an owner and a target. Customer service metrics are everything you can measure: experience, efficiency, quality and workload. Every KPI is a metric, but not every metric deserves to be a KPI.
Customer service KPIs at a glance
Use this table as a reference, and follow the links for a full guide to each metric. Benchmarks appear only where we could check the original source. Where there is none, compare against your own baseline.
| KPI | Definition | Formula | What good looks like |
|---|---|---|---|
| CSAT | Share of customers satisfied after a conversation | Satisfied responses ÷ total responses × 100 | Rising against your own baseline. For live chat, LiveChat’s 2024 average is 64.2% (LiveChat) |
| NPS | Likelihood to recommend the company | % promoters (9 to 10) − % detractors (0 to 6) | Above 0 is good, above 50 is excellent, per Bain (Qualtrics) |
| CES | How easy it was to get an issue resolved | Average score on a 1 to 7 ease scale | Higher is better. Effort predicts loyalty (HBR) |
| IQS | Quality against your own scorecard | Points earned ÷ points possible × 100 | Set by your scorecard. Trust it only with high coverage |
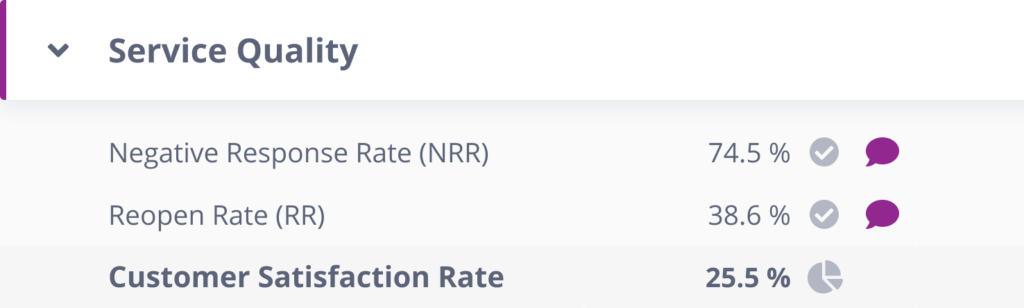
| Negative response rate | Share of negative customer ratings | Negative ratings ÷ all ratings | Falling, with no clusters by agent or topic |
| Escalation rate | Share of conversations passed up a tier | Escalated ÷ total conversations × 100 | Stable, with known causes for every spike |
| First reply time | Wait before the first human response | Total wait before first reply ÷ inquiries | For live chat, LiveChat’s 2024 average is 35 seconds (LiveChat) |
| Average resolution time | Time from first message to solved | Total resolution time ÷ cases resolved | Falling without reopens rising. See also AHT |
| Backlog | Open conversations past your SLA | Count of open tickets older than SLA, daily | Flat or shrinking |
| FCR | Issues solved in the first contact | Resolved on first contact ÷ total × 100 | 70 to 79% is good, 80% or more is world class for contact centers (SQM Group) |
| Reopen rate | Solved tickets that come back | Reopened ÷ solved × 100 | Low and stable, investigated whenever it climbs |
| Comments to solve | Messages needed per resolution | Total messages ÷ tickets resolved | Falling within each issue type |
| Automated resolution rate | Issues fully solved without a human | Resolved by bot or self-service ÷ total × 100 | Rising, with quality checked on automated conversations |
| Handled tickets by channel | Resolved volume per channel | Count per channel per period | Matches your staffing plan |
| Agent utilization | Share of time spent on conversations | Productive time ÷ available hours | Sustainable for your team, never used to rank agents |
Leading vs. lagging indicators: read this before picking KPIs
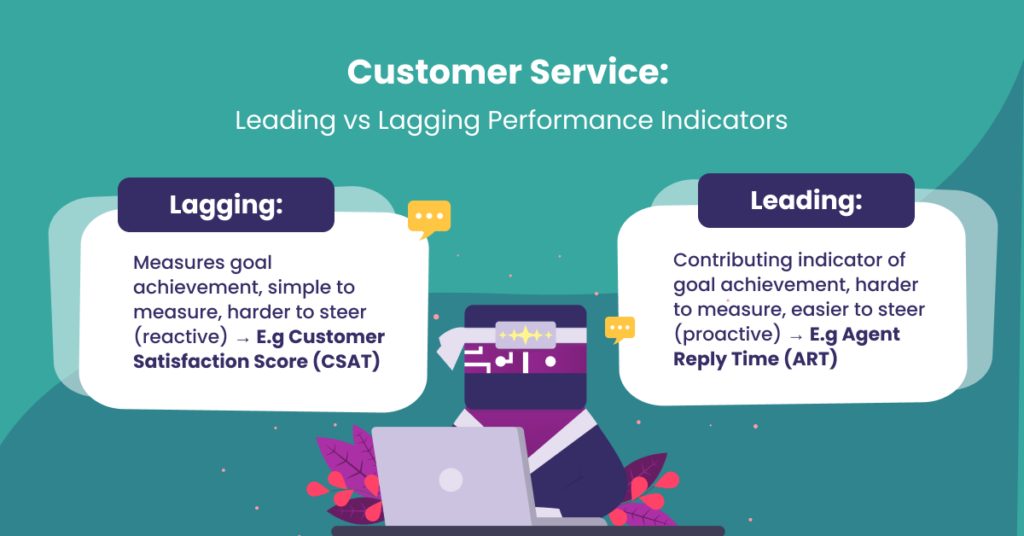
Most teams track outcomes: CSAT, churn, resolution numbers. Those are lagging indicators. They tell you what already happened, after you can do anything about it.
Leading indicators move first: quality scores, first reply time, backlog growth, escalation rate. When quality dips this week, satisfaction dips next month. Mix both, and when a lagging number moves, your leading indicators should already have told you why.
Experience metrics: how customers felt
1. Customer Satisfaction Score (CSAT)
Formula: satisfied responses ÷ total responses × 100.
The default pulse of support. Sent after a conversation closes, usually as a 1 to 5 rating where 4 and 5 count as satisfied.
The trap: response bias. Only a small share of customers answer, and they are disproportionately the delighted and the furious. CSAT also punishes agents for product problems they did not cause. Our guide on how to measure customer satisfaction covers the design details that reduce the bias.

2. Net Promoter Score (NPS)
Formula: % promoters (9 to 10) minus % detractors (0 to 6) on the “would you recommend us” question.
NPS measures the whole relationship, not one conversation, which makes it a company metric more than a support metric.
The trap: using it to evaluate support. A customer who loves your service but hates your pricing is a detractor anyway. Track it, but do not hang agent performance on it.
3. Customer Effort Score (CES)
Formula: average of “how easy was it to get your issue resolved” (1 to 7).
The research behind CES (Harvard Business Review’s “Stop Trying to Delight Your Customers”) found effort predicts loyalty better than delight. Customers rarely leave because you failed to amaze them. They leave because you were hard work.
The trap: effort often lives in what customers did before reaching you (searching, waiting, repeating themselves), so pair the score with journey data or you will fix the wrong step. For how the three experience scores compare, see CSAT vs NPS vs CES.
Quality metrics: how your team actually performed
4. Internal Quality Score (IQS)
Formula: quality points earned ÷ points possible × 100, scored against your own QA scorecard.
The one metric on this list you fully control, and the only one that separates “customer was unhappy” from “we performed badly.” Full breakdown in our Internal Quality Score guide.
The trap: sample size. Scored on 3 to 5 tickets per agent per week, IQS swings on a single bad ticket. Know your coverage before trusting the number.
5. Negative Response Rate (NRR)
Formula: negative customer ratings ÷ all ratings.
The mirror of CSAT, and often more informative: negative ratings cluster around specific issues, agents, or days, which makes them a debugging tool. Our guide to DSAT goes deeper.
The trap: small volumes swing hard. Three bad ratings in a slow week is not a trend. Look for the cluster before reacting.
6. Escalation rate
Formula: escalated conversations ÷ total conversations × 100.
Rising escalations signal a knowledge gap on the front line, an authority gap (agents can’t resolve), or a product regression generating harder tickets. All three are fixable, with different fixes.
The trap: pushing the rate down by discouraging escalation. That converts visible escalations into invisible bad answers.
Speed metrics: how long customers waited
7. First Reply Time (FRT)
Formula: total wait time before first response ÷ number of inquiries.
The metric customers feel most. A fast, human first touch buys patience for everything after it. Expectations vary by channel: seconds for chat, hours for email. Across LiveChat’s customers, the average first chat response is 35 seconds (LiveChat, 2024).
The trap: auto-acknowledgments that game the clock. Customers know the difference between a reply and a receipt.
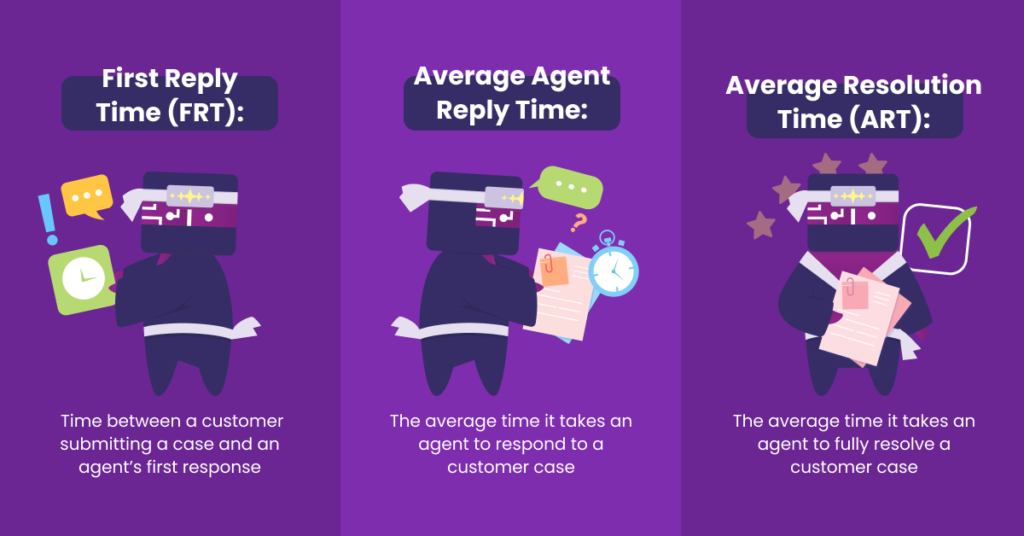
8. Average Resolution Time (ART)
Formula: total resolution time ÷ cases resolved.
The end-to-end promise: how long from “I have a problem” to “it’s solved.” On the phone, the closer cousin is average handle time.
The trap: averages hide the disasters. Track the 90th percentile alongside the mean, because the customer who waited nine days does not care that the average was nine hours. And never target resolution time without a quality pair, or agents will close tickets that are not done.
9. Backlog
Formula: open conversations older than your SLA threshold, counted daily.
The earliest warning signal in support. When backlog grows, the other numbers on this list tend to follow it down a week or two later.
The trap: heroic backlog burndowns that trade quality for closure. Watch reopen rate during every backlog push.
Effectiveness metrics: did the problem actually die?
10. First Contact Resolution (FCR)
Formula: issues resolved on first contact ÷ total issues × 100.
The best single proxy for “our answers are complete.” SQM Group puts the contact center average at 71%, rates 70 to 79% as good, and 80% or more as world class (SQM Group). More in what is FCR.
The trap: channel mix distorts it. Chat resolves simple things instantly, while email carries the complex cases. Compare FCR within channels, not across them. Our chat metrics guide covers the chat-specific numbers.

11. Reopen Rate (RR)
Formula: reopened tickets ÷ tickets solved × 100.
The lie detector for your speed metrics. If resolution time falls while reopens rise, you did not get faster. You got sloppier.
The trap: there is barely one. It is the most under-tracked useful metric in support. Set a threshold from your own history and investigate anything above it.
12. Comments to Solve
Formula: total messages exchanged ÷ tickets resolved.
How much conversation each resolution costs. Rising comments-to-solve usually means unclear first answers, missing information gathering, or a knowledge gap. Tracked per agent, it is a precise coaching signal: the agent whose resolutions take eight messages instead of four has a specific, fixable habit.
The trap: some ticket types need long threads. Segment by issue type before comparing agents.

13. Automated Resolution Rate
Formula: issues fully resolved by self-service or AI without human touch ÷ total issues × 100.
The newest metric on the list and increasingly the one executives ask about. As AI agents handle more volume, you need to know what share of demand they truly resolve. Our guide to containment rate explains why the number can mislead.
The trap: counting deflection as resolution. A bot that made the customer give up is a silent failure. Audit automated conversations with the same quality standard as human ones. Nobody manually samples ten thousand bot chats, so this is where automated QA across 100% of conversations becomes necessary.
Volume and workload metrics: what the work costs
14. Handled Tickets by Channel
Formula: count of resolved conversations, split by channel, per period.
The staffing map. Channel mix shifts slowly and then suddenly (a product launch, a new market), and teams staffed for last year’s mix produce this year’s backlog.
The trap: treating all tickets as equal work. Weight by handle time when planning capacity.
15. Agent workload and utilization
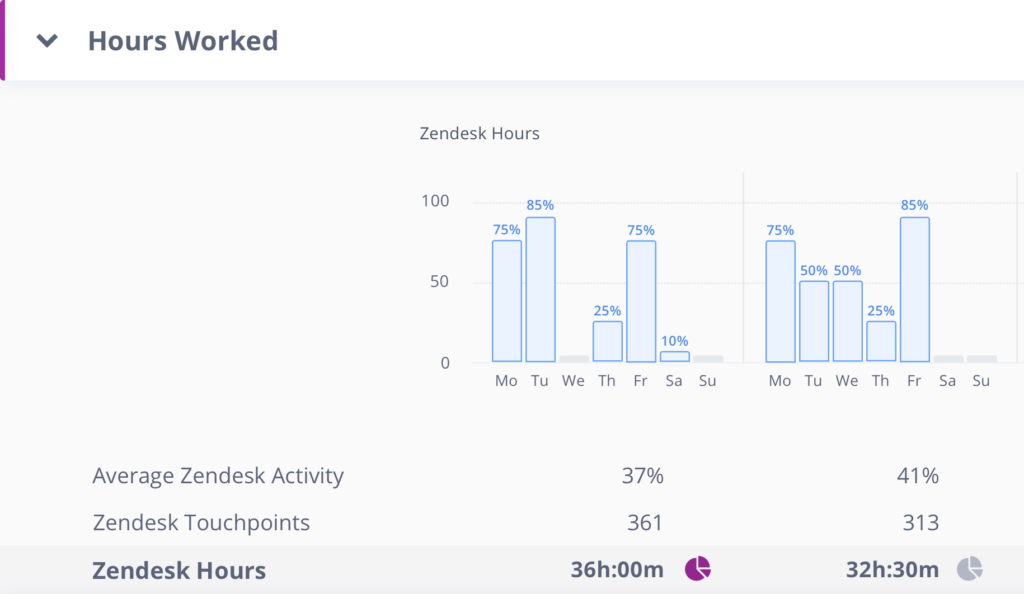
Formula: productive conversation time ÷ available working hours.
Very high utilization looks efficient on paper and produces burnout, sick leave and quality decay in practice. This is the metric that protects all the others.
The trap: using it to rank agents. Workload is a management outcome, not an agent choice.
How to choose your 5 (not track all 15)
Fifteen metrics is a reference, not a dashboard. Pick one per question:
| The question | Pick one of |
|---|---|
| How do customers feel? | CSAT, CES |
| How well did we perform? | IQS, NRR |
| How fast are we? | FRT, ART (with a P90) |
| Did problems actually die? | FCR, reopen rate |
| Is the workload sustainable? | Backlog, utilization |
Two pairing rules prevent most dashboard lies: every speed metric needs a quality partner, and every satisfaction metric needs an internal-standard partner. Gartner’s research found 52% of QA leaders now see their program’s main value as voice-of-the-customer insight, which is what a well-paired dashboard becomes: an early-warning system.
Review the set quarterly against your goals. Our guides on customer experience metrics and improving customer satisfaction help when the goal shifts from measuring to moving the numbers.
Putting the metrics to work with scorecards
Numbers change behavior only when someone owns them. A team scorecard assigns each KPI an owner, a target, and a review cadence: weekly for leading indicators, monthly for lagging ones.
Where quality assurance fits
Most KPIs on this list describe outcomes. They tell you CSAT dropped or reopens rose, but not why. The why sits in the conversations themselves, and a manual QA sample of a few tickets per agent rarely contains it. Scoring every conversation against your scorecard gives you IQS at full coverage and ties each number back to the tickets behind it. Kaizo’s insights then show whether a dip comes from a broken process, product friction or a skill gap, so you fix the cause instead of chasing the metric.
Related reading
- Customer service QA glossary
- CSAT vs DSAT: the difference
- How to reduce DSAT
- The call center QA metrics that predict CSAT
- What is conversation intelligence?
Frequently asked questions
What are the 4 most important metrics of customer service?
If you can only track four: CSAT (experience), IQS (quality), first reply time (speed), and first contact resolution (effectiveness). That set catches most problems from at least one angle.
What are the 5 key performance indicators for customer service?
The same four plus reopen rate, which keeps the speed and resolution numbers honest. Add backlog as a sixth if your volume is spiky.
What’s the difference between customer service metrics and KPIs?
Metrics are everything you can measure. KPIs are the few you have committed to moving this quarter, with an owner and a target. Every KPI is a metric, but not every metric deserves to be a KPI.
What is a good CSAT score for customer service?
There is no single benchmark, because scales, survey timing and channels differ. For live chat, LiveChat’s 2024 data shows an average of 64.2% for rated chats (LiveChat). Track your own trend by channel, and if scores look suspiciously high, check your survey design for bias before celebrating.
How many customer service KPIs should a team track?
Five to seven. Fewer misses whole categories, and more dilutes ownership. One per question you need answered, plus a pairing metric for anything speed-related.
The dashboard is the easy part
Every metric here can be assembled in an afternoon. What separates teams is what happens when a number moves: whether anyone notices, whether they can find the why, and whether the fix gets verified. That loop of noticing, diagnosing, fixing and re-measuring is what a measurement culture produces.
If you want your quality, speed, and coaching metrics calculated across 100% of conversations instead of a sample, book a demo and we’ll show you on your own data.