IQS (internal quality score) is the percentage of quality points your support team earns when its conversations are scored against your own QA scorecard. It shows whether agents met your standards, separately from how customers felt.
In short
- IQS = (points earned / points possible) × 100.
- Most established support teams target an IQS of 75 to 85%.
- Unlike CSAT or NPS, it separates agent performance from product problems.
- A small review sample makes the score noisy, so coverage matters.
You already track CSAT. Maybe NPS too. And yet neither tells you whether your agents actually followed the process, gave accurate answers, or handled that angry customer well. A customer can leave a glowing rating after an agent promised something your product can’t do.
That gap is what the Internal Quality Score exists to close.
What is IQS in customer service?
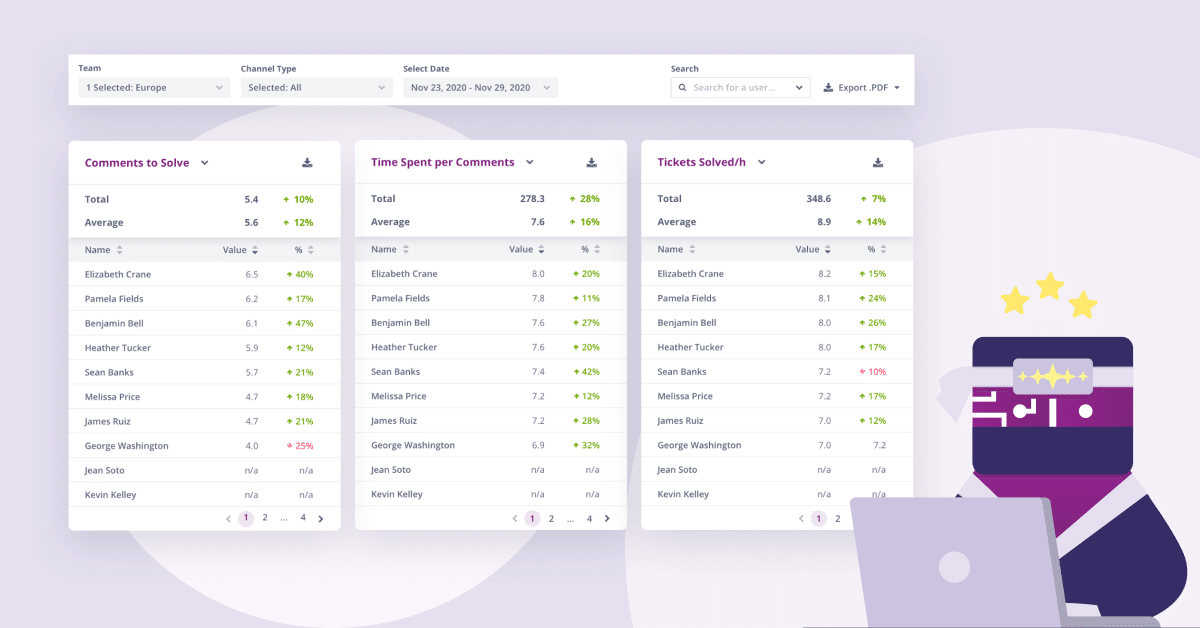
The Internal Quality Score (IQS) is a metric that measures the quality of your team’s customer interactions against standards you define yourself. A reviewer (or an AI) evaluates conversations using a QA scorecard, and the combined results become a single percentage.
The “internal” part is the point. CSAT asks customers how they felt. IQS asks: did we do what we say quality looks like? You define the criteria, you set the weights, and you own the standard.
One note on terminology, since “IQS meaning” trips people up: the automotive industry uses IQS for J.D. Power’s Initial Quality Study, which measures defects in new cars. Different metric entirely. If you’re here for customer service, you’re in the right place.
What is the full form of IQS?
IQS stands for Internal Quality Score. Some teams call it the internal quality assurance score or simply the QA score; they all refer to the same thing, a percentage that expresses how well reviewed conversations met your quality criteria. If you hear “quality score” in a contact center context without further qualification, this metric is usually what’s meant.
How is IQS different from CSAT, NPS, and CES?
Each metric answers a different question, and they’re not interchangeable.
| Metric | Question it answers | Who provides the data | Blind spot |
|---|---|---|---|
| IQS | Did our team meet our quality standards? | Internal reviewers or AI | Doesn’t capture customer emotion directly |
| CSAT | Was the customer satisfied with this interaction? | Customers | Influenced by product issues, pricing, mood; low response rates |
| NPS | Would the customer recommend us? | Customers | Measures the whole brand, not support |
| CES | How easy was it to get help? | Customers | Says nothing about accuracy or compliance |
The practical difference: when CSAT drops, you know something is wrong but not what. When IQS drops, you can see exactly which criterion failed, on which team, in which channel. That’s why the two work best together. Pair them and you can spot the conversations where the customer was happy but the agent gave a wrong answer, or where the agent did everything right and the customer was still frustrated by the product. We break down how these metrics interact in our guide to customer service metrics and KPIs.
There’s also a bigger shift behind this. Gartner research from June 2024 found that among service leaders who rate their QA program highly valuable, 52% say that is mainly because of voice-of-the-customer insight, while only 19% point to rep performance. Quality scores stopped being just an HR instrument a while ago.
How do you calculate the Internal Quality Score?
The formula itself is simple:
IQS = (points earned / points possible) × 100
In words: divide the points a conversation earned by the points it could have earned, then multiply by 100. For a team or agent score, average that percentage across every reviewed conversation.
The work is in what sits behind it. Here’s the process most teams follow.
1. Define your scorecard criteria
Group your quality standards into categories. The classics:
- Case handling: Did the agent give correct and complete information? Did they escalate when they should have?
- Support skills: Did they show empathy? Did they adapt when the customer’s request changed mid-conversation?
- Language: Grammar, spelling, tone matching your brand voice.
- Critical errors: Sharing sensitive data, quoting the wrong customer, breaking a compliance rule.
Our customer service QA checklist has a full set of example criteria you can steal.
2. Weight the criteria
Not every mistake is equal. A typo costs a point; leaking personal data should sink the entire evaluation. Most teams make critical errors an automatic fail while soft skills carry moderate weight. Getting these weights right matters more than the number of criteria, so revisit them quarterly. In Kaizo, scorecards carry these weights and can be scoped per team, queue or client. Our guide to building a QA scorecard covers weighting in detail.
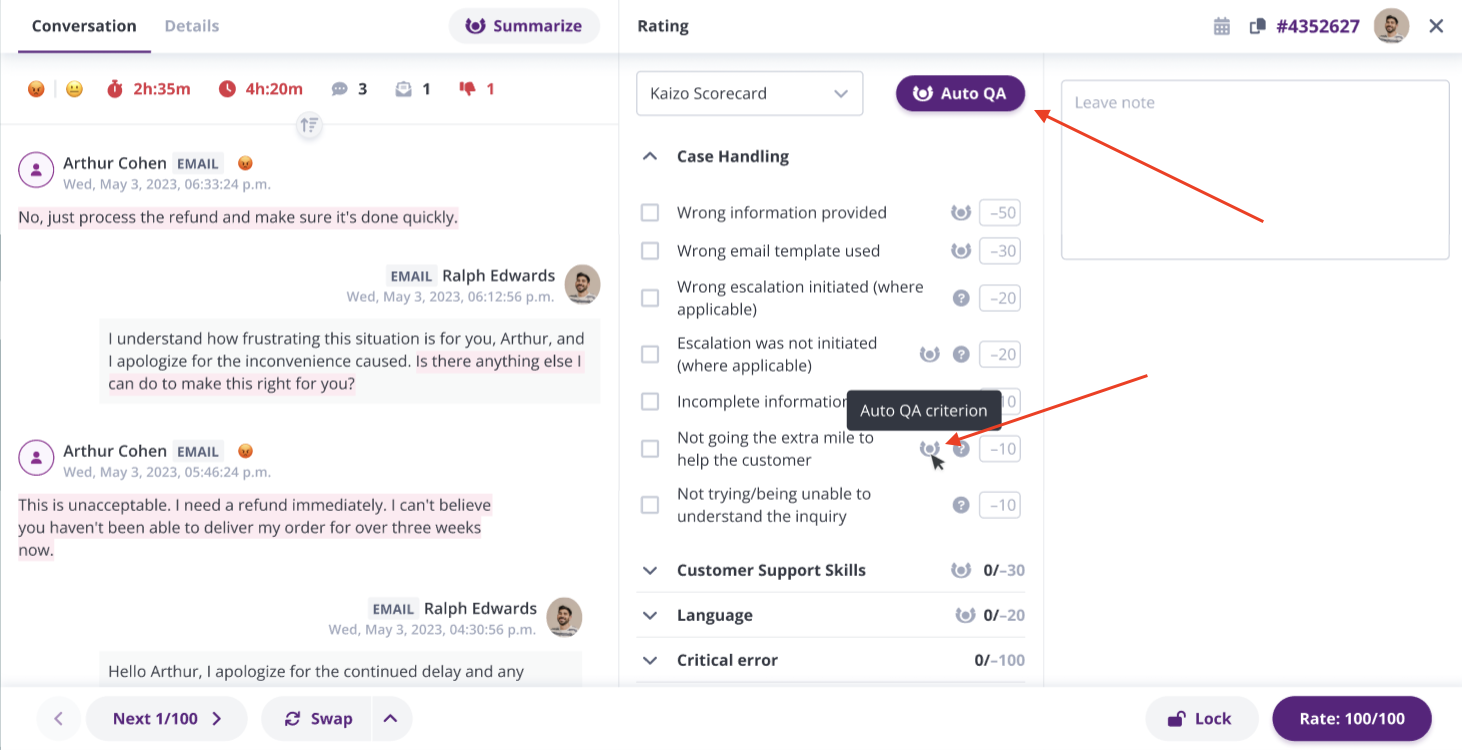
3. Score conversations and aggregate
Reviewers evaluate tickets against the scorecard. Say a conversation earns 42 of 50 possible points: that’s an IQS of 84% for that ticket. Average across all reviewed conversations and you have your team score. Slice it by agent, team, channel, or time period.
Worked example. Your scorecard has four categories worth 25 points each. An agent scores 25 (case handling), 20 (support skills), 22 (language), 25 (no critical errors). That’s 92 of 100 points, so this conversation scores 92%. Do this across 200 reviewed tickets and the average, say 81%, is your monthly IQS.
If you’re running QA in a spreadsheet, this aggregation is where things get painful. Purpose-built tools handle it automatically. In Kaizo, for instance, a QA admin sets up the scorecard once, every reviewer rates against the same criteria, and the IQS rolls up per agent, team, and time frame in dashboards without anyone touching a formula.
4. Calibrate your reviewers
Two reviewers scoring the same ticket should land on the same result. They usually don’t at first. Regular calibration sessions, where multiple reviewers score identical conversations and compare notes, are what turn IQS from an opinion into a metric. Skip this and your score measures reviewer mood, not conversation quality.
What is a good IQS score?
Short answer: it depends on how strict your scorecard is. A 95% on a lenient scorecard means less than an 80% on a demanding one. That said, useful reference points exist:
- 75 to 85% is where most established support teams set their target.
- Above 90% usually signals either an excellent team or a scorecard that’s too easy. Check which one before celebrating.
- Below 70% typically points to a training gap, unclear processes, or criteria that don’t match reality.
The trend matters more than the absolute number. An IQS moving from 78% to 84% over two quarters tells you coaching is working. A static 90% tells you nothing except that nobody is looking closely.
Benchmark yourself against your own history first, and only then against industry numbers. Scorecards differ so much between companies that cross-company comparisons flatter or punish you for reasons that have nothing to do with quality.
Do IQS scores change over time?
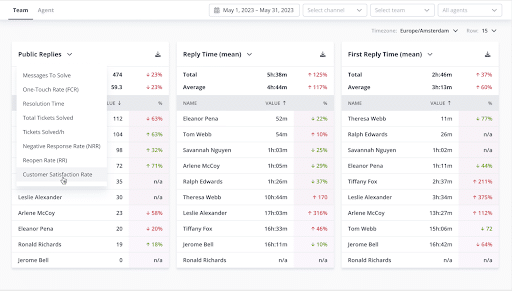
Yes, and a stable IQS is actually the suspicious case. Expect movement from four directions:
- New hires. A cohort of new agents typically pulls team IQS down 5 to 10 points for a quarter. That’s not a quality problem, it’s a ramp curve. Track cohorts separately so a hiring wave doesn’t read as a team decline.
- Scorecard changes. Every time you add, remove, or reweight a criterion, your IQS resets its meaning. Annotate scorecard changes on your reporting timeline, otherwise next year’s you will chase a “drop” that was really a stricter scorecard.
- Seasonality. Peak periods compress handle time and stretch agents across more conversations. Most teams see a measurable IQS dip during their busy season. Plan coaching before it, not during it.
- Score inflation. Reviewers drift lenient over time, especially when they score the same agents month after month. If your IQS climbs steadily while CSAT stays flat, inflation is the more likely explanation than improvement. Calibration sessions are the correction mechanism.
The practical takeaway: judge IQS as a trend with context, never as a single number. A 4-point swing means nothing in a month where you onboarded six agents and shipped a new scorecard.
Where does IQS data come from?
Three layers feed the score:
- The conversations themselves. Tickets, emails, chats, and call recordings or transcripts, pulled from your helpdesk or contact center platform. This is the raw material.
- The scorecard. Your criteria, weights, and fail conditions. This turns a conversation into points.
- The evaluations. A human reviewer, an AI, or both, applying the scorecard to each conversation. Whoever does the evaluating, the output is the same: points earned per criterion, per conversation.
What IQS deliberately does not use: customer survey responses. That separation is the feature. CSAT tells you how the customer felt; IQS tells you what your team did. Mixing the two data sources destroys your ability to tell those stories apart.
Why does IQS matter?
Beyond “quality is good,” IQS earns its place on your dashboard for specific reasons:
- It isolates support performance from product problems. Customers rate their whole experience. If your product frustrates them, CSAT drops even when agents perform brilliantly. IQS filters that noise out.
- It makes coaching specific. A low CSAT says “improve.” A low IQS on the escalation criterion says “train the team on when to escalate.” One of these is actionable. The purpose of QA in a call center is exactly this translation from score to action.
- It catches problems before customers do. Compliance slips and wrong answers show up in QA reviews before they show up in churn.
- It gives you evidence for headcount and budget conversations. “Quality dropped 6 points after we cut the training program” is an argument leadership understands.
The sampling problem: when your IQS lies to you
Here’s the uncomfortable part that most IQS guides skip.
The typical QA team reviews 3 to 5 tickets per agent per week. For a team handling real volume, that’s somewhere between 1 and 5% of all conversations. Your IQS, the number on the leadership dashboard, describes a tiny sample. The other 95%+ sits in a gray zone nobody has looked at.
Small samples create two specific failures:
- Statistical noise. With five reviewed tickets, one bad conversation swings an agent’s score by 20 points. You end up coaching people for variance, not performance.
- Selection bias. Reviewers often pick tickets that are easy to find or already flagged. The quiet failures, the wrong answer delivered politely, never enter the sample.
How big is the noise problem? Here’s the margin of error on an IQS around 80%, by monthly review volume:
| Conversations reviewed per month | Your “true” IQS could be off by |
|---|---|
| 25 | ±16 points |
| 50 | ±11 points |
| 100 | ±8 points |
| 250 | ±5 points |
| 500 | ±3.5 points |
| Every conversation | 0, you’re measuring, not estimating |
At 25 reviews a month, a reported IQS of 80% is statistically compatible with anything from 64% to 96%. Most teams celebrating a 3-point improvement are reading noise.
The manual fix is to review more tickets, randomize selection properly, and accept the cost. Some teams do exactly that, and for a small team it can be enough.
The structural fix is automation. AI-based auto QA evaluates every conversation against your scorecard instead of a sample, which turns IQS from an estimate into a measurement. This is the direction the category is moving: Kaizo’s automated QA scores every ticket against your scorecard, and calibration sessions keep reviewers and the AI on the same standard, so the score reflects a consistent standard rather than one rater’s judgment on a given day. Coverage changes what the score is based on. Calibration changes whether you can trust what it says.
If you’re weighing the manual and automated approaches, our comparison of automated quality assurance workflows goes deeper.
How do you improve a low IQS?
A low score is a starting point, not a verdict. The sequence that works:
Find the failing criterion, not the failing agent. If half the team misses the same criterion, the problem is a process or the criterion itself. Fix the system before coaching individuals.
Coach with evidence. Generic feedback (“be more empathetic”) changes nothing. Tie every coaching point to specific conversations. Agents accept feedback they can see. Our guide to customer service coaching covers how to structure these sessions, and tools help here too: Kaizo generates coaching cards from QA data automatically, so team leads spend their time coaching rather than compiling.
Re-measure at 30, 60, and 90 days. Coaching without re-measurement is a suggestion. Track whether the targeted criterion actually improves in the next cycle.
Review the scorecard itself twice a year. Standards drift. Channels change. A scorecard written for email QA measures chat conversations badly. Quality assurance is a living process, not a one-time setup; the distinction between quality assurance and quality control matters here.
A free IQS scorecard template you can copy
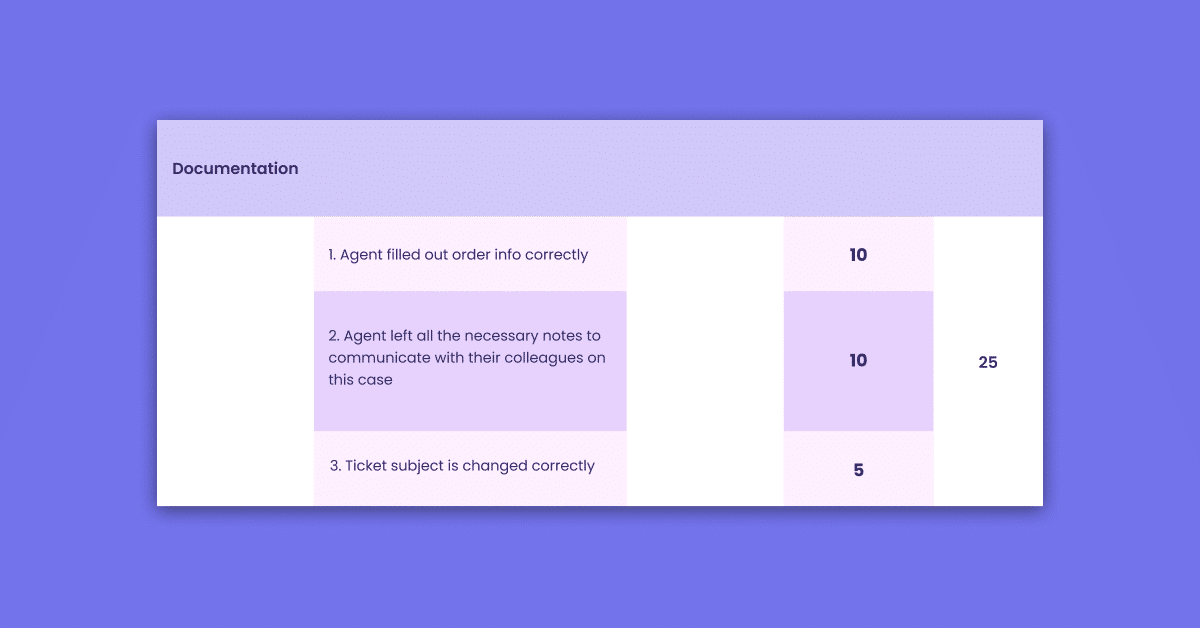
Steal this as a starting point. Four categories, 100 points, one auto-fail rule.
| Category | Criterion | Points |
|---|---|---|
| Case handling (35) | Correct and complete solution provided | 20 |
| Case handling | Proper escalation or follow-up initiated when needed | 10 |
| Case handling | Internal notes and tagging complete | 5 |
| Support skills (30) | Acknowledged the customer’s actual problem | 10 |
| Support skills | Empathy and tone appropriate to the situation | 10 |
| Support skills | Adapted when the request changed | 10 |
| Language (15) | Grammar and spelling | 5 |
| Language | Clear structure, no jargon | 5 |
| Language | Brand voice | 5 |
| Process (20) | Followed the documented procedure | 10 |
| Process | Correct macros/templates used | 5 |
| Process | Handled within SLA | 5 |
| Critical error (auto-fail) | Wrong customer data shared, security or compliance breach | Score = 0 |
Adjust the weights to your reality. A fintech should weight process and compliance heavier; an e-commerce team might push more points into case handling. The auto-fail rule is the one part we’d keep in every version: some mistakes shouldn’t be averaged away.
How do you report IQS to leadership?
The mistake is reporting the number alone. An IQS of 82% means nothing to a VP without context. What works:
- Trend plus annotation. The 6-month IQS line with scorecard changes and hiring waves marked on it.
- Pair it with CSAT. The two lines together answer the question leadership actually has: is quality driving satisfaction?
- One failing criterion, one action. “Escalation handling scored 61% this quarter; we’re running targeted coaching and will re-measure in 30 days” beats a dashboard of forty numbers.
- Coverage disclosure. State what percentage of conversations the score is based on. It’s the single most important transparency marker in a QA report, and almost nobody includes it.
Related reading
- Agentic Auto QA, how Kaizo scores 100% of conversations automatically
- What is 100% QA coverage? (the fix for the sampling problem)
- The QA scorecard: framework, examples and template
- What is auto QA?
- What is conversation intelligence?
- How to turn QA data into agent coaching
- How to validate AI QA scoring
- How accurate is AI QA?
- What is DSAT?
Frequently asked questions
What does IQS stand for?
In customer service, IQS stands for Internal Quality Score: the percentage of quality points your team earns across reviewed conversations. (In the car industry, the same abbreviation refers to J.D. Power’s Initial Quality Study, which is unrelated.)
What is a good QA score?
Most support teams target an IQS between 75 and 85%. Scores above 90% deserve scrutiny of the scorecard’s difficulty, and scores below 70% usually indicate training or process gaps rather than bad agents.
How is IQS calculated?
Divide the quality points earned by the points possible, then multiply by 100. A ticket scoring 42 of 50 points has an IQS of 84%. Team IQS is the average across all evaluated conversations.
How many tickets should you review for a reliable IQS?
More than almost anyone does manually. At 3 to 5 tickets per agent per week you’re sampling under 5% of conversations, which makes individual scores noisy. Either increase and randomize your sample, or use AI-based QA software to evaluate every conversation.
Is IQS better than CSAT?
Neither replaces the other. CSAT measures how customers feel; IQS measures whether your team met your standards. Used together, they show you where those two things diverge, and that divergence is usually where the interesting problems live.
What makes an IQS reliable?
The scorecard and the consistency of scoring beneath it. An IQS is a summary, and a summary is only as good as what it summarizes: if criteria are vague and reviewers score them differently, the IQS measures reviewer opinion rather than quality. A reliable IQS rests on clear criteria, calibrated reviewers, and ideally full coverage rather than a small sample, and it can be traced down to the criterion and the conversation, so a movement in the number becomes a specific finding you can coach.
Do IQS scores change over time?
Yes. New-hire cohorts, scorecard changes, seasonal volume, and reviewer drift all move the score. Judge the trend with context rather than any single month’s number.
What is the full form of IQS?
IQS is the Internal Quality Score, sometimes called the internal quality assurance score: the percentage of quality points earned across evaluated customer conversations.
Measure what you can actually see
IQS is the one support metric you fully control: your standards, your scorecard, your definition of good. That control is also its risk, because a score built on a thin sample and uncalibrated reviewers gives you confident-looking noise.
Get the foundations right first. Clear criteria, honest weights, calibrated reviewers. Then push your coverage up, because every conversation you don’t review is a data point you’re guessing about.
If you want to see what IQS looks like at 100% coverage, book a demo and we’ll show you on your own tickets.