Chat metrics are the numbers that show how well your live chat support performs, on speed, resolution and customer sentiment. The nine worth tracking are below, each with a formula, a sourced benchmark where one exists, and how to move it.
In short
- Start with First Response Time, First Contact Resolution and CSAT.
- LiveChat’s 2024 data puts the average first response at 35 seconds.
- Compare chat numbers within chat, never against phone or email.
- Pair every speed metric with a quality score on the same chats.
Chat metrics are how you stop guessing. Measured properly, they tell you where agents are fast and where they stall, which questions keep coming back, and whether customers leave a chat happy or frustrated. This guide covers the nine that earn their place on a dashboard, then the one thing a metrics dashboard alone will never tell you.
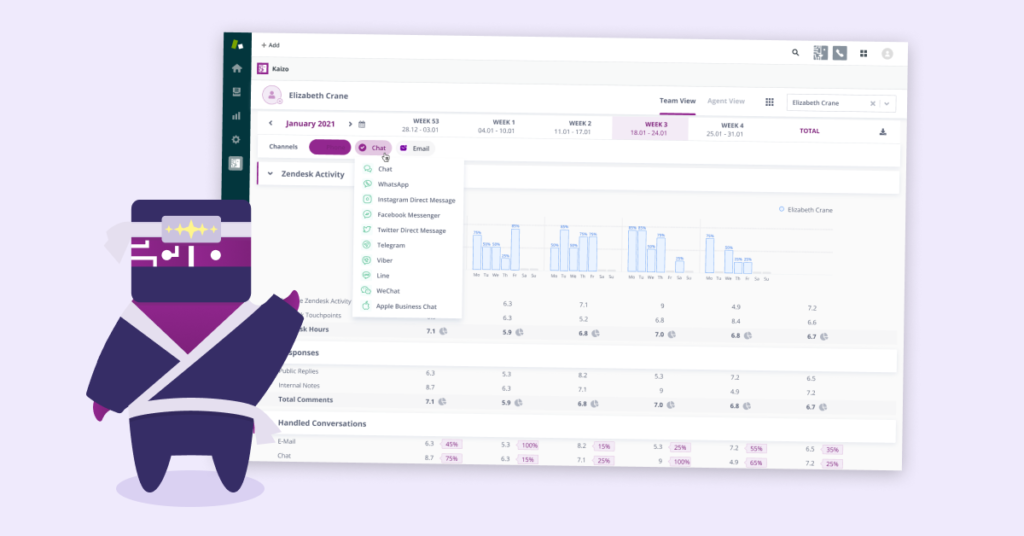
Chat metrics at a glance
Here is the whole set in one view. Benchmarks are only listed where we could check the original source. Where there is none, the target is your own trend line.
| Chat metric | Formula | What good looks like |
|---|---|---|
| First Response Time (FRT) | Average of (first agent reply − customer’s first message) | Average across LiveChat customers: 35 seconds (LiveChat, 2024) |
| First Contact Resolution (FCR) | (Chats resolved on first contact ÷ total chats) × 100 | 70 to 79% is good, 80% or more is world class for contact centers (SQM Group) |
| Average Resolution Time (ART) | Total resolution time ÷ number of resolved chats | Average chat lasts 8 minutes 25 seconds (LiveChat, 2024) |
| Total Number of Chats | Count of opened, missed and resolved chats per period | No target. Watch for spikes and dips |
| CSAT | (Positive responses ÷ total responses) × 100 | Average for rated chats: 64.2% (LiveChat, 2024). Beat your own baseline |
| NPS | % promoters − % detractors | Above 0 is good, above 50 is excellent, per Bain (Qualtrics) |
| Missed and abandoned chats | (Missed or abandoned chats ÷ total incoming) × 100 | Average queue dropout: 27.4% (LiveChat, 2024). Lower is better |
| Tags (contact reasons) | Categorized count of tagged chats | No target. Track the top drivers over time |
| Chats per agent | Total chats ÷ number of agents | Average: 84.1 chats per agent per day (LiveChat, 2024). Use for staffing, not scoring |
The metrics you choose will depend on your business, and more is not better. Pick the handful that map to your goals, get them reliable, and only then expand. For the wider picture of how these fit alongside phone and email measures, see our guide to customer service metrics and KPIs.
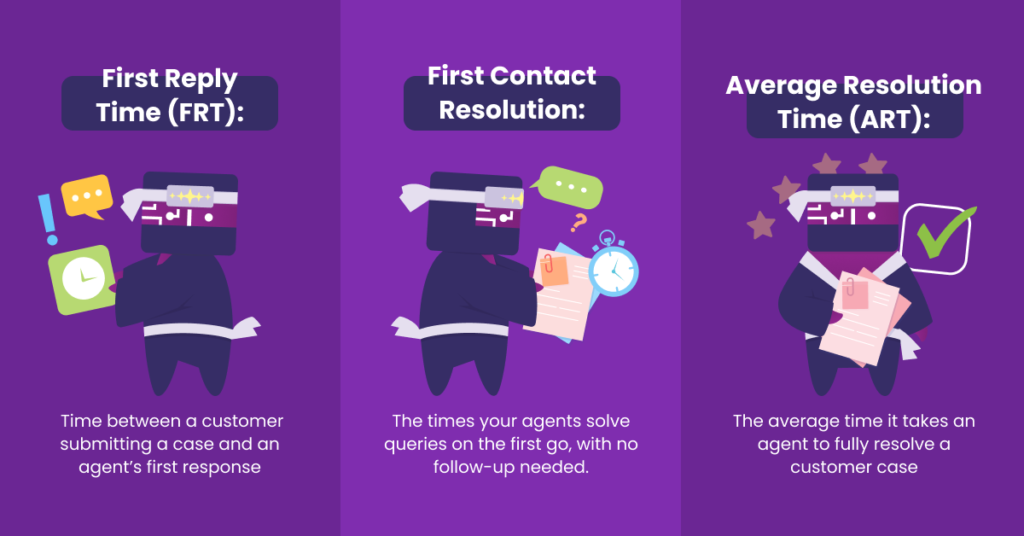
1. First Response Time (FRT)
What it measures: how long a customer waits between sending their first message and getting the first reply from an agent.
Formula: average of (time of first agent reply − time of customer’s first message) across all chats.
Benchmark: across LiveChat’s customer base the average first response is 35 seconds (LiveChat Customer Service Report, 2024). Treat that as a reference point, not a target for every team.
First response time sets the tone. It is usually the first impression a customer forms of your support team, and live chat carries a specific expectation: it is called live for a reason, so customers expect an almost immediate reply. Wait too long and frustration sets in before the conversation has even started.
Response-time expectations vary by platform and industry, so it is worth setting a target that matches yours rather than chasing a generic number. Our breakdown of what drives a high first reply time covers the usual culprits.
How to improve it:
- Track FRT across days, weeks, and seasons. A sustained climb usually means agents are overwhelmed at specific times, which is a staffing signal, not a performance problem.
- Use concurrency. Unlike phone, one agent can handle several chats at once, so tuning the number of concurrent chats per agent is one of the fastest ways to cut wait time.
- Deploy saved replies for common openers so agents acknowledge the customer instantly while they work on the full answer.

2. First Contact Resolution (FCR)
What it measures: the share of chats resolved in a single conversation, with no follow-up needed.
Formula: (chats resolved on first contact ÷ total chats) × 100.
Benchmark: SQM Group rates 70 to 79% as good and 80% or higher as world class (SQM Group). Those figures come from contact centers in general, so use them as a rough guide for chat.
FCR is one of the clearest predictors of customer satisfaction. When customers get a complete answer the first time, they walk away happy; when they have to come back, satisfaction drops with every repeat. A low FCR usually points to one of three things: agents need more training, your knowledge base is hard to search, or the issues themselves are genuinely complex.
How to improve it:
- Coach and train agents so they have the tools and product knowledge to resolve issues on the spot rather than escalating.
- Compare FCR across channels. A high FCR on phone but a low one on chat often signals a tooling or knowledge-access gap specific to chat.
- Keep your internal knowledge base current so agents can find the right answer without putting the customer on hold.
3. Average Resolution Time (ART)
What it measures: the average time to fully resolve a chat, from the opening message to the moment the issue is closed.
Formula: total resolution time ÷ number of resolved chats.
Benchmark: the average chat lasts 8 minutes 25 seconds across LiveChat’s customers (LiveChat, 2024).
ART shows how efficiently your team closes issues and highlights which agents or topics take longest, which is a coaching opportunity. But treat it as a context metric, never in isolation. Consider two customers with the same issue: one is resolved in a day but kept informed the whole way and feels reassured, the other is resolved in an hour with a single terse reply. Faster is not automatically better. A longer conversation where the customer feels heard can beat a quick one that leaves them cold.
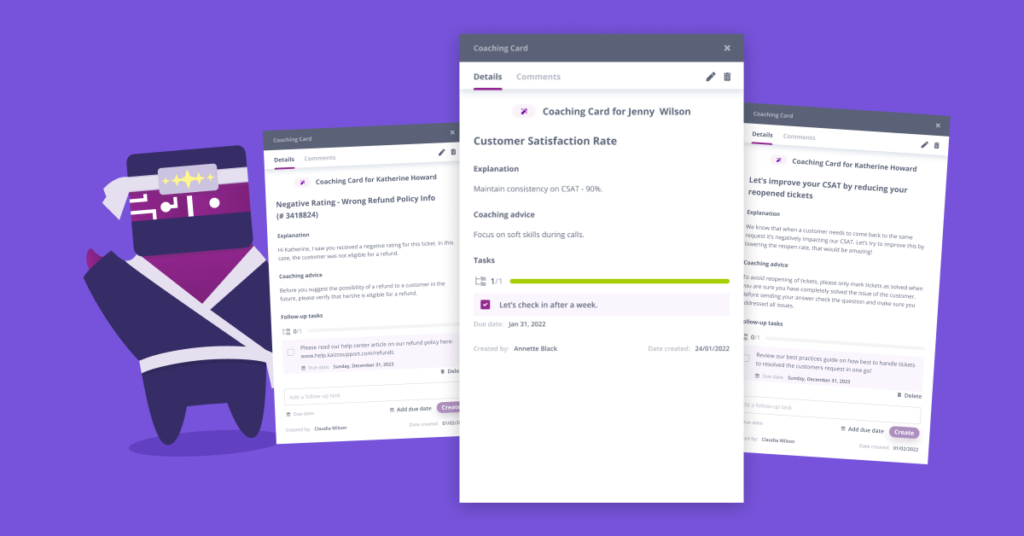
Because ART is so easy to misread, it is the metric where scores need to become coaching rather than a stick. Tie every slow chat back to a specific conversation and use it to teach, not to rank. Kaizo turns quality findings into per-agent AI coaching cards, so managers coach from real examples instead of compiling spreadsheets. More on that below.
How to improve it:
- Meet customers on the channels they already use, so they respond quickly and conversations do not stall.
- Organize canned responses for frequent questions to deliver faster, consistent replies.
- Route chats automatically to the right team so customers are not bounced between agents.
4. Total Number of Chats
What it measures: the high-level count of opened, missed, and resolved conversations over a set period.
Formula: a simple count of chat conversations in your chosen window, broken down by status.
Benchmark: this one is trend-based rather than a fixed target. What matters is the shape of the curve and the anomalies in it.
Total chat volume is your engagement gauge and a productivity input, but its real value is in the surprises. A low number during a peak season can mean customers cannot find your chat widget. A high number of the same query means the answer is too hard to find on your site. Read the volume as a diagnostic, not just a tally.
How to improve (or interpret) it:
- Publish answers to the most common queries on an FAQ or help page to keep repeat questions out of the queue.
- Adjust staffing to match seasonal peaks so higher volumes do not degrade your other metrics.

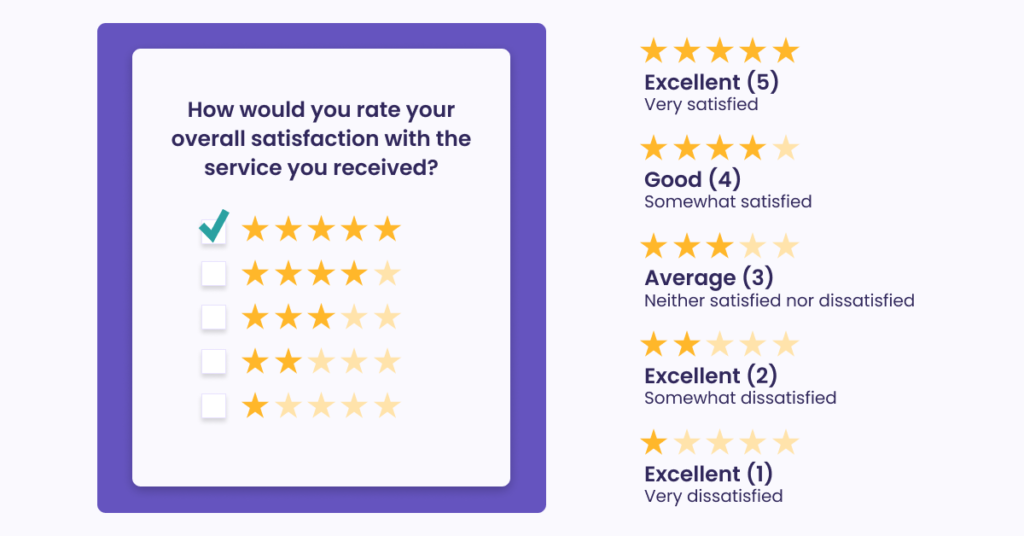
5. Customer Satisfaction (CSAT)
What it measures: how satisfied customers are immediately after a chat, usually captured with a one-click post-chat survey.
Formula: (positive responses ÷ total responses) × 100.
Benchmark: LiveChat reports an average satisfaction score of 64.2% for rated chats (LiveChat, 2024). Only a small share of chats get rated, so your own trend matters more than the industry figure.
CSAT is the staple satisfaction metric across every channel, and live chat suits it well because you can ask for feedback the moment the conversation ends, while the experience is fresh. Positive and negative ratings together paint a clear picture of where service is thriving and where it needs work. Measured regularly, CSAT reveals trends in customer behavior and gives you real-time signal to act on.
Speed and satisfaction are linked. Long waits put customers in a bad mood before the conversation starts, so fixing FRT is often the fastest route to a better CSAT.
How to improve it:
- Improve First Response Time so customers are not waiting when the survey lands.
- Coach and train to lift First Contact Resolution, since resolved-first-time chats score highest.
- Use canned responses to speed up Average Resolution Time without sacrificing warmth.
For the full playbook, see how to improve customer satisfaction.
6. Net Promoter Score (NPS)
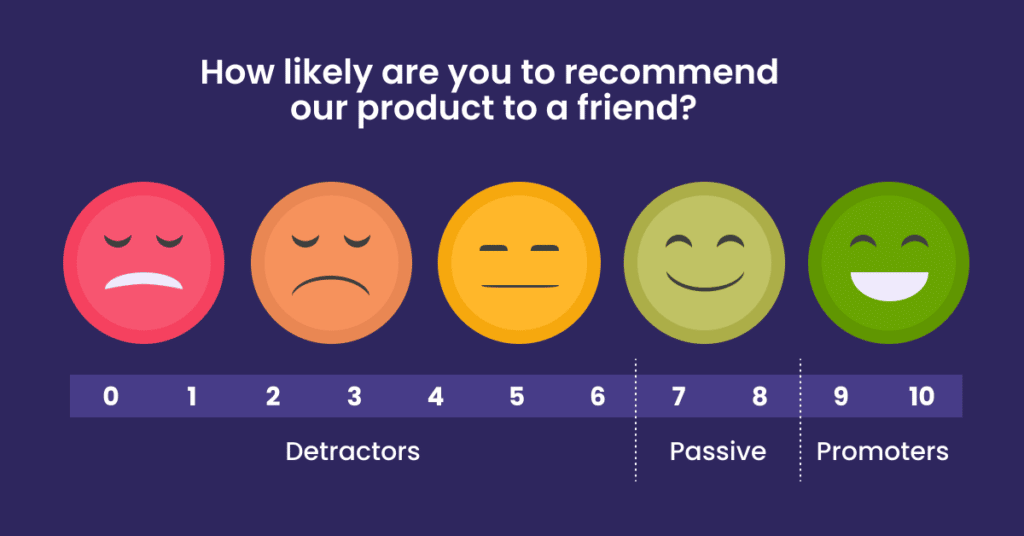
What it measures: how likely customers are to recommend you, on a 0 to 10 scale.
Formula: % promoters − % detractors. Scores of 9 to 10 are promoters, 7 to 8 are passives, and 0 to 6 are detractors.
Benchmark: Bain & Company, which created NPS, treats any score above 0 as good and above 50 as excellent (Qualtrics).
NPS is a single question that reveals a lot. The catch is that happy customers rarely volunteer their enthusiasm, which is where live chat helps: a survey that appears automatically at the end of a chat prompts a response in the moment, while goodwill is high. Detractors (0 to 6) are at risk of spreading negative word of mouth, passives (7 to 8) are satisfied but not loyal, and promoters (9 to 10) are the advocates worth nurturing.
How to improve it:
- Engage detractors proactively. Their feedback is uncomfortable but it is the cheapest early warning you will get.
- Follow up with promoters through chat, with an offer, a request for a review, or a simple thank you.
- Route the feedback to the decision-makers who can actually act on it.
7. Missed and abandoned chats
What it measures: the requests you never answered (missed chats) and the ones customers gave up on before an agent replied (abandoned chats).
Formula: (missed or abandoned chats ÷ total incoming chat requests) × 100.
Benchmark: keep it as low as you can. Across LiveChat’s customers, 27.4% of people in a queue left before an agent picked up (LiveChat, 2024).
Making a customer wait is one problem. Missing their message entirely is worse. If you offer live chat, customers expect availability, and a consistently high missed-chat rate, or sharp swings in it, is a clear sign something needs fixing. Unanswered chats do not just dent your metrics, they damage trust, so contacting the customers whose chats you missed matters more than the number itself.
How to improve it:
- Use AI chatbots to handle simple questions when agents are unavailable, so no request goes completely unanswered.
- Talk to agents about workload and multitasking, and make it normal to ask for help when the queue spikes.
- Pressure-test your tooling. Is your platform actually provisioned for your peak chat volume?
8. Tags (contact reasons)
What it measures: why customers are chatting in, captured by categorizing each conversation.
Formula: a categorized count of tagged chats, ideally automated by your support software over time.
Benchmark: there is no target number. The value is in seeing your top contact drivers and how they shift.
Tags let whoever reviews a chat classify what it was about, and over time a good support tool automates that collection. The payoff is knowing which questions come up most, so you can route them to help-center articles, write new ones, or fix the underlying product or process issue. Tagging also builds a library of reference material for training on rare, complex cases.
How to improve it:
- Make category creation a deliberate, top-down decision that maps to your KPIs, so you do not drown in tags that measure nothing useful.
- Be consistent. Tagging only works if everyone applies the same categories the same way.
9. Chats per agent
What it measures: average agent workload and how efficiently you are using chat capacity.
Formula: total chats ÷ number of agents over the month.
Benchmark: LiveChat’s average is 84.1 chats per agent per day (LiveChat, 2024), but your number depends on chat complexity and concurrency. Use it for staffing decisions rather than as a performance score.
Chats per agent tells you whether your investment in chat is being used well, but it is volatile and shaped by forces outside any team lead’s control, from seasonal spikes to one-off events. December almost always brings a surge, which teams cover with seasonal hires or outsourced support. High numbers can tip agents into overload, and a persistently low number can signal a deeper problem, so read this metric in context.
How to improve it:
- To lower it, revisit workflow and staffing, and check in with agents. A high number can mean someone is in permanent hyper-drive, so make sure they have support and take their breaks. Sustained overload is a leading cause of call center burnout.
- To raise it, match the work to the skill. Handling high chat volume rewards fast, accurate typists, so route heavy chat load to the agents suited to it, and support the rest.
Beyond the dashboard: what chat metrics do not tell you
Here is the limit of everything above. Chat metrics measure outcomes: how fast you replied, how often you resolved, how satisfied customers said they were. What they do not measure is whether the answer your agent gave was actually correct, compliant, and on-brand. A chat can close in 90 seconds with a delighted CSAT rating and still contain the wrong information.
Quality is judged separately, and traditionally it is judged on a tiny manual sample. A typical QA team reviews three to five chats per agent per week, under 5% of the total. Your speed dashboard covers 100% of conversations while your quality view covers almost none of them, and that mismatch is where problems hide. This is also why measuring the Internal Quality Score (IQS) alongside your chat metrics matters: CSAT tells you the customer was happy, IQS tells you the work was actually good.
The fix is to stop sampling. AI-based auto-QA evaluates every chat against your scorecard instead of a handful. Kaizo’s AutoQA scores conversations automatically, and Autopilot runs continuously in the background so coverage stays at 100% without anyone triggering reviews. Your quality score stops being an estimate from 5% of chats and becomes a measurement of all of them, and your QA team shifts from grading to coaching.
Gartner research found that 52% of QA leaders now say their program’s primary value is voice-of-the-customer insight, not rep scoring. In other words, the record of what happens in your chats has become one of the richest sources of intelligence a company has, and reading only 5% of it leaves most of that value on the table.
Neutral by design, which matters more every quarter
One point specific to this moment. As chat teams deploy AI agents to handle conversations, someone has to grade the quality of those AI agents, and most QA vendors now sell their own AI agents, which means grading their own homework. Kaizo does not sell AI agents, so it can evaluate any conversation, human or AI, without that conflict of interest. As your chat channel becomes a mix of human and automated responses, a neutral quality layer is the only one you can trust to score both fairly.
Frequently asked questions
What are chat metrics?
Chat metrics are the measurements that show how well your live chat support performs, covering both speed (First Response Time, Average Resolution Time), effectiveness (First Contact Resolution, missed chats), and customer sentiment (CSAT, NPS). Tracked together, they tell you how your team is doing and where to improve, provided you pair the outcome numbers with a quality measure of whether answers were actually correct.
What is a good response time for live chat?
The average first response across LiveChat’s customers is 35 seconds (LiveChat, 2024), so a reply inside a minute keeps you in a reasonable range. Speed matters because customers drop out of slow queues: LiveChat measured an average queue dropout of 27.4%.
How do you measure live chat performance?
Track a balanced set: a speed metric (First Response Time), an effectiveness metric (First Contact Resolution or Average Resolution Time), a sentiment metric (CSAT or NPS), and a coverage metric (missed and abandoned chats). Then add a quality score based on reviewing the content of chats, not just their outcomes, so you know the fast, well-rated chats were also accurate.
What is a good CSAT score for live chat?
LiveChat’s 2024 data shows an average satisfaction score of 64.2% for rated chats. Few customers rate chats, so compare against your own baseline before the industry figure. The quickest way to raise CSAT is usually to cut First Response Time and lift First Contact Resolution.
Which chat metrics should you track first?
Start with First Response Time, First Contact Resolution, and CSAT. They cover speed, effectiveness, and satisfaction with the least overhead, and they are tightly linked, so improving one often lifts the others. Add missed-chat rate and a quality score next, then expand only once those are reliable. Too many metrics at once causes a lack of focus.
Measure to improve
You cannot manage what you cannot see, and that is the whole case for chat metrics. Too many team leads still stitch performance together from a stack of spreadsheets, spending more time compiling numbers than acting on them. The point of a metric is the decision it lets you make, so pick the handful that map to your goals, get them reliable, and change the strategy as you learn.
Just remember what the dashboard cannot show you. Speed and satisfaction numbers describe every chat, but the quality of the answers inside them is usually judged on a sliver. Close that gap, measure the content of your chats as completely as you measure their outcomes, and your metrics start reflecting reality instead of a sample of it.
If you want to see what your chat quality looks like at 100% coverage, scored automatically and turned into coaching, book a demo and we will run it on your own conversations.